San Francisco Market Update.
Rates have suddenly risen much more rapidly than expected. But, relief is in sight.
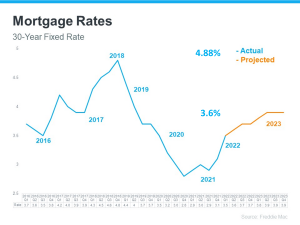
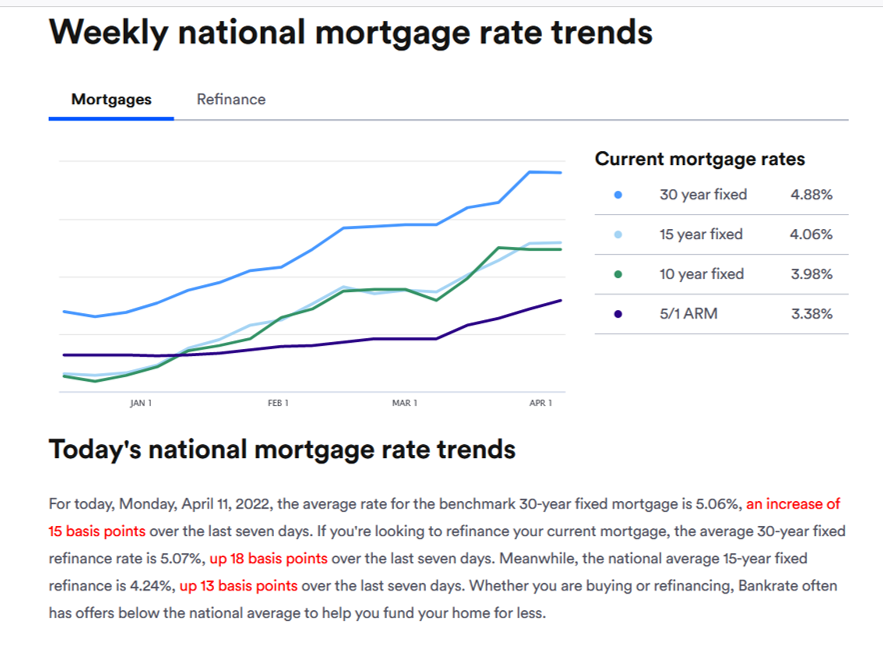
The blue line represents the actual National average interest rate for a 30-year fixed mortgage from Q1 2016 to Q2 2022. The orange line represents Freddie Mac's predictions for rates through Q4 2023. They predicted that rates in the current quarter would reach 3.6% and that by Q4 2023, they would rise to 3.9%. As of April 12, the National average has already hit 4.88%! Why such a rapid increase? Inflation.
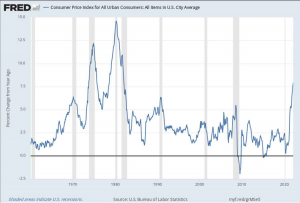
This chart shows the Consumer Price Index from 1960 to now. You can see that inflation was much higher in the 1970s and early 1980s than it is today. That is when the federal reserve began taking steps to keep inflation low. And it worked. Since 2010, the Fed has kept inflation below 3 - until 2020. From pre-pandemic to now, inflation has risen from 1.5 to the number just released for March which is 8.5 - a new 40-year high.
The question on everyone's mind is: when will it get better? Major drivers of the current high rates are oil, food, and used car prices. Oil prices were the lowest in history during the early stages of the pandemic because people were not driving and not flying. So, the global supply was dramatically reduced to avoid the high cost of storage. Now that air travel is up by 71% and people are driving more, the lack of supply of crude oil has driven the price up. The price of crude has actually come down recently, but I'm sorry to say that there is a delay before we will see decreases in the price at the pump - perhaps late April or early May. Food prices have increased in part because Russia and Ukraine account for approximately 29% of global wheat exports and a lot of sunflower oil which is used in the production of many food products. Used car prices (up by around 40%) are so high because of supply chain disruption. With a low supply of semi-conductors, new car production is way down causing high demand for used cars. All of these prices - oil, food, and used cars - are on their way down. Most economists agree that the CPI will be a bit better in April and May as many of these issues improve. As we return to normal spending trends, prices will come down and the Federal Reserve will allow interest rates to continue to rise but at a much slower pace.
FIRST-QUARTER SUMMARY
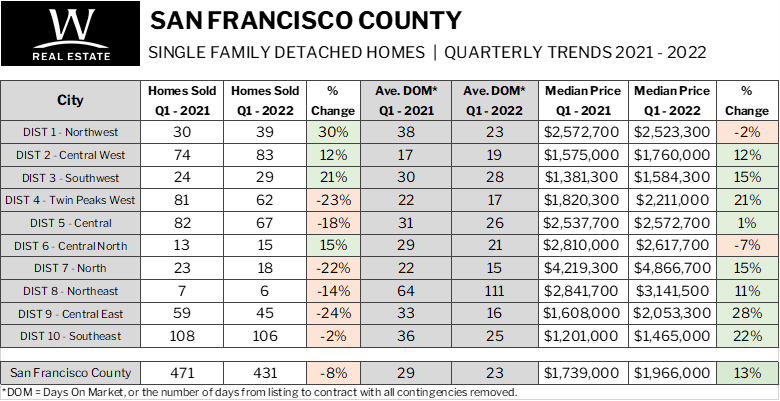
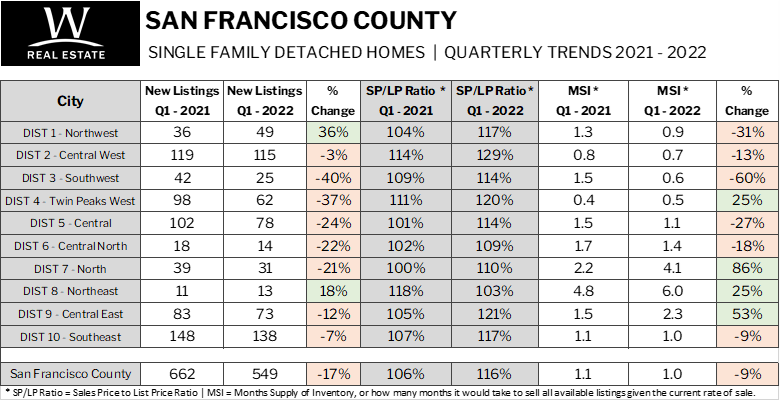
The major takeaways from these Year-over-Year statistics are that Sales in the county were down 8% while New Listings were down by 17%. So, while both sales and listings were down, listings dropped more rapidly, which continued the trend of decreased inventory. Demand, however, was still high as buyers scramble to get a home into escrow and lock down an interest rate before they go any higher. Because of this persistent supply/demand imbalance, the average number of days it took from listing to contract with all contingencies removed was 23, down from 29 days in Q1 2021, and, on average they sold for 116% of the list price, compared with 106% Q1 2021. The supply/demand disparity also continued to put pressure on sales prices which were up, on average, from $1,739,000 Q1 2021 to $1,966,000 Q1 2022 - an increase of 13%.

Property Sales (Sold)
March property sales were 210, down
4.1% from 219 in March of 2021 and
72.1% higher than the 122 sales last month.
Current Inventory (For Sale)
The total number of properties available this month was 152, down by
10.1% compared with March 2021. This year's smaller inventory means that buyers who waited to buy may have a smaller selection to choose from. The number of currently available listings is up
2.7% compared to the previous month.
Property Under Contract (Pending)
There was an increase of
19.1% in the pended properties in March, with 224 properties versus 188 last month. This month's pended property sales were
2.2% lower than at this time last year.
SUMMARY
The housing market continues to be at the effect by numerous global issues, chief of which are the pandemic, the war between Russia and Ukraine, disruption in the supply chain, and the cost of crude oil. These factors are in a constant state of flux which makes it difficult to predict the future. What we do know is that we continue to have a shortage of available homes for sale. Nationally, this is largely due to a dramatic decrease in new construction. The good news is that building permits and starts are both up. Unfortunately, that has not yet translated into more completed projects due to supply chain issues - many of the materials needed to complete construction are in short supply. The other primary reason for low inventory is the strength of buyer demand since the Federal Reserve lowered interest rates to fuel the economic recovery. And, even though rates are on the rise now, they are still extremely low. Despite all of the challenges, locally and globally, many industry experts are still bullish about the 2022 real estate market. The following are some very hopeful quotes.
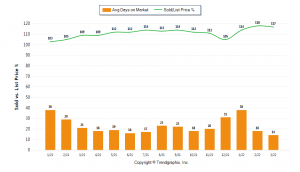
The Days on Market Shows a Downward Trend
The average Days on Market (DOM) shows how many days the average property is on the market before in goes into escrow with all contingencies removed. The DOM for March 2022 was 14, down 22.2% from 18 days last month and down 33.3% from 21 days in March of last year.The Sold Price/Original List Price Ratio is Relatively Steady
The Sold Price/Original List Price reveals the average amount that Sellers are agreeing to come down from their original list price. The lower the ratio is below 100% the more a Buyer's market exists, while a ratio at or above 100% indicates more of a Seller's market. This month's Sold Price vs. List Price Ratio of 117% is down 0.8% from last month and up from 7.3% in March of last year.
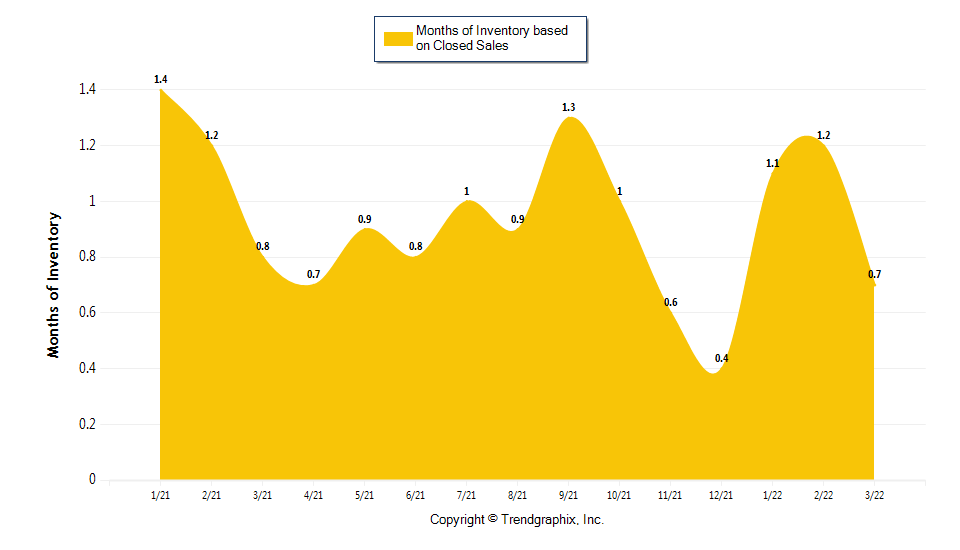 A comparatively lower Month's Supply of Inventory is more beneficial to Sellers while a higher supply is better for Buyers. A comparatively lower Month's Supply of Inventory is more beneficial to Sellers while a higher supply is better for Buyers.
Months Supply of Inventory based on Closed Sales
The March 2022 Months Supply of Inventory based on Closed Sales of 0.7 was down by 13% compared to last year and down 41.2% compared to last month. March 2022 is clearly a Seller's market.
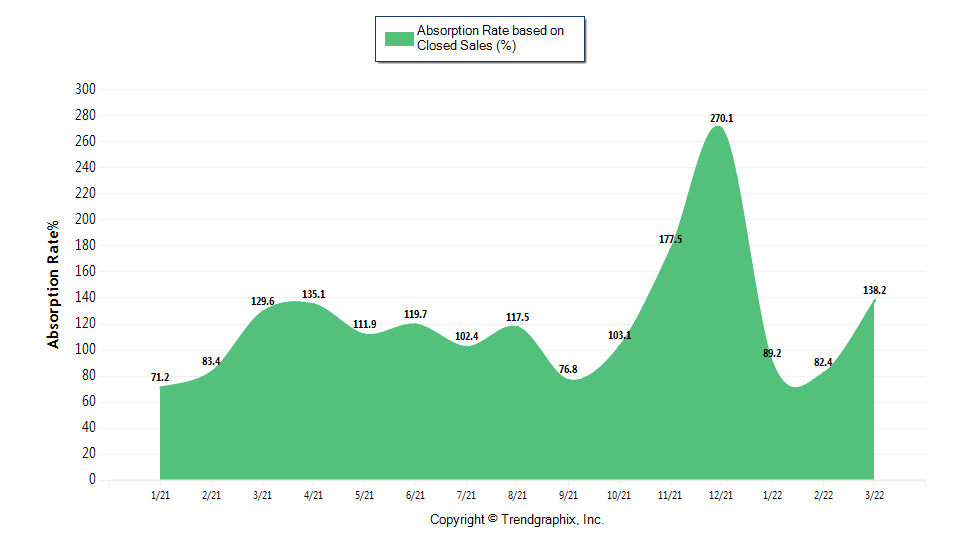
The Absorption Rate measures the inverse of the Month's Supply of Inventory and represents how much of the currently active listings (as a percentage) are being absorbed each month.
Absorption Rate based on Closed Sales
The March 2022 Absorption Rate based on Closed Sales of 138.2 increased by 6.6%compared to last year and up 67.7% compared to last month.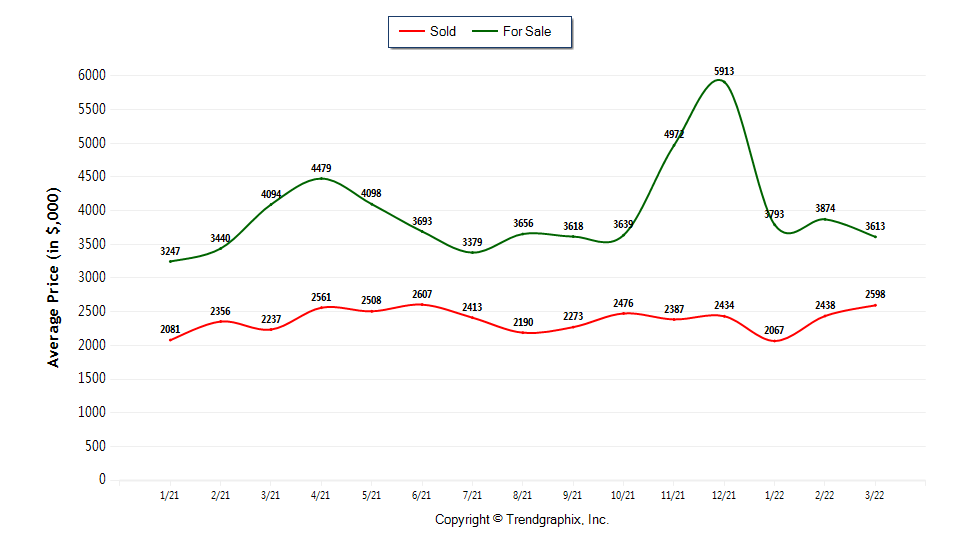
The Average For Sale Price Shows a Downward Trend
The Average For Sale Price in March was $3,613,000, down 11.7% from
$4,094,000 in March of 2021 and down 6.7% from $3,874,000 in the previous month.
The Average Sold Price is Trending Up
The Average Sold Price in March was $2,598,000, up 16.1% from $2,237,000 in
March of 2021 and up 6.6% from $2,438,000 in the previous month.
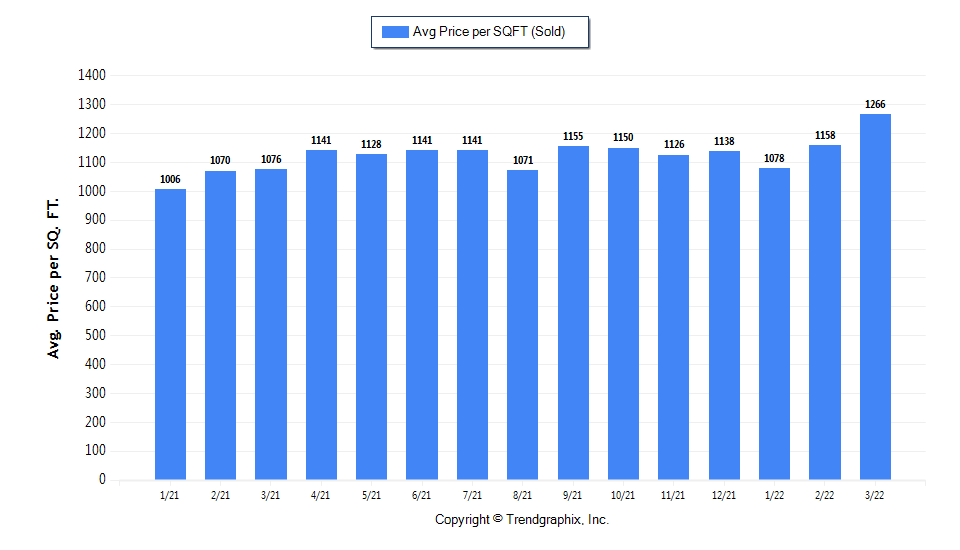
The Average Sold Price per Square Foot is Showing an Upward Trend
Since Median Sold Price and Average Sold Price can be impacted by the 'mix' of high or low-end sales, the Average Sold Price per Square Foot is a more normalized indicator of the direction property values are headed. The March 2022 Average Sold Price per Square Footage of $1266 was up 9.3% from $1158 in February and up 17.7% from $1076 in March 2021.
CURRENT MORTGAGE INTEREST RATES
as of April 11
SUMMARY
The housing market continues to be at the effect by numerous global issues, chief of which are the pandemic, the war between Russia and Ukraine, disruption in the supply chain, and the cost of crude oil. These factors are in a constant state of flux which makes it difficult to predict the future. What we do know is that we continue to have a shortage of available homes for sale. Nationally, this is largely due to a dramatic decrease in new construction. The good news is that building permits and starts are both up. Unfortunately, that has not yet translated into more completed projects due to supply chain issues - many of the materials needed to complete construction are in short supply. The other primary reason for low inventory is the strength of buyer demand since the Federal Reserve lowered interest rates to fuel the economic recovery. And, even though rates are on the rise now, they are still extremely low. Despite all of the challenges, locally and globally, many industry experts are still bullish about the 2022 real estate market. The following are some very hopeful quotes.
As always, I will continue to keep my fingers on the pulse of the real estate market and report back to you next month. In the meantime, enjoy the warmer weather and all of the many outdoor recreational opportunities the Bay Area and north have to offer. I welcome you to get in touch with me with any of your real estate questions. And, if you know of anyone who is thinking of buying or selling a home, I would be happy to meet with them and give them the same caring, professional service I offer to all of my past clients.
|


