THE FEDERAL FUNDS RATE INCREASED BY 50 BASIS POINTS
HOW DOES THIS AFFECT THE HOUSING MARKET?
|
|
| If inflation is the villain of our economic story, the Federal Reserve Bank is the superpower that fights to keep it under control. |
|
| Although the March inflation number hit a 40-year high of 8.5, inflation in the 1980s rose to nearly 15. That is when Paul Volcker, then Chairman of the Fed, decided to take on the task of controlling inflation. And how do you control consumer spending? With interest rates. |
|
|
This chart shows the close correlation between inflation and interest rates. So, it makes sense that if you want to change the inflation trend line, you do so by changing the interest rate line. To lower inflation, the Fed increases interest rates which curb consumer spending and cools off the economy. To strengthen the economy, they lower interest rates, which encourages spending but has the negative effect of increasing inflation.
|
|
|
When Fed policymakers want to raise interest rates on 15 and 30-year fixed mortgages, they sell government bonds. This sale reduces the price of bonds and raises the yield (interest rate). We can also think of this as the Fed reducing the money supply. This makes money less plentiful and drives up the price of borrowing. When we fell into a recession, as a result of the debilitating economic effects of Covid19, the Fed decided to lower interest rates in order to fuel the economic recovery. So they started buying massive amounts of long-term bonds and kept the Fed Funds Rate at 0 -.25. As consumer spending increased, so did inflation. When it jumped from 1.5 to 8, the Fed decided it was time to reverse its policy and slow down the economy. So now they are selling bonds and raising the Fed funds rate. The hope is that the Fed can crush inflation while not killing an economy that lately has looked vulnerable to shocks.
|
|
| GOOD NEWS JUST IN On May 12th, the April Inflation rate was announced and for the first time since the rate began its meteoric rise, it has come down! Not a lot, 8.5 to 8.3, but that is great news. It didn’t go up. In June we should receive a report that it went down even more in May. |
|
|
|
SUMMARY MARKET TRENDS
April 2021 – April 2022
|
|
|
APRIL 2022 SUMMARY – April repeated the same major trends we saw in the first quarter. Year-over-year, sales were down by 16% while new listings were down by 45%. The continuing decrease in housing inventories reduced the average days from listing to sale (with all contingencies removed) from 18 days to 14 and is keeping the pressure on home prices. In April the median sales price of a single-family detached home in San Francisco increased by 14%. So, for now, we remain in an extreme seller’s market. As interest rates continue to rise, demand will wane, inventories will increase and we will slowly transition to a buyer’s market.
|
|
Property Sales (Sold)
April closed sales were 195, down 15.6% from 231 in April of 2021 and 8.9% lower than the 214 sales in March. Current Inventory (For Sale)
Versus last year, the total number of properties available in April was lower by 7 units or 4.1%. This year’s lower inventory means that buyers who waited to buy may have a smaller selection to choose from. The April inventory was up 7.9% compared to the previous month. Property Under Contract (Pended)
There was the same number of pended properties in April and there were in March, 224. This month’s pended property sales were 9.3% lower than at this time last year. |
|
|
The Days on Market Shows Downward Trend
The average Days on Market (DOM) show how many days the average property is on the market before it sells. An upward trend in DOM tends to indicate a move toward a Buyer’s market, a downward trend indicates a move towards a Seller’s market. The DOM for April 2022 was 14, down 6.7% from 15 days in March and down 22.2% from 18 days in April of last year. **The Sold/List Price Ratio is Rising**
The Sold Price vs. List Price reveals the average amount that sellers are agreeing to come down from their list price. The lower the ratio is below 100% the more of a Buyer’s market exists, a ratio at or above 100% indicates more of a Seller’s market. This April, the Sold Price vs. List Price ratio of 120% was up 2.6% from March and up 10.1% from 109% in April of last year. * Based on 6-month trend – Upward/Downward/Neutral
** Based on 6-month trend – Rising/Falling/Remains Steady
|
|
The Months Supply of Inventory is the number of months it would take to sell all available listings given the rate of sale. A comparatively lower supply of inventory is more beneficial for sellers while a higher supply is better for buyers.
Buyer’s market: more than 6 months of inventory
Seller’s market: less than 3 months of inventory
Neutral market: 3 – 6 months of inventory Months of Inventory based on Closed Sales
The April 2022 Months of Inventory based on Closed Sales of 0.8 was 14.3% higher than in March and April 2021. April 2022 was Seller’s market. |
|
|
Absorption Rate measures the inverse of Months of Inventory and represents how much of the currently active listings (as a percentage) are being absorbed each month.
Buyer’s market: 16.67% and below
Seller’s market: 33.33% and above
Neutral market: 16.67% – 33.33% Absorption Rate based on Closed Sales
The April 2022 Absorption Rate based on Closed Sales of 118.9 was 12% lower than in April 2021, and down 15.6% compared to March.
|
|
The Average For Sale Price is Neutral
The Average For Sale Price in April was $3,762,000, down 16% from $4,479,000 in April of 2021 and up 4.1% from $3,613,000 in March. The Average Sold Price is Neutral
The Average Sold Price in April was $2,562,000, just $1,000 more than in April of 2021 and down 0.5% from $2,575,000 in March. The Median Sold Price is Neutral
The Median Sold Price in April was $2,100,000, up 13.5% from $1,850,000 in April of 2021 and down 4.5% from $2,200,000 last month. * Based on 6-month trend – Appreciating/Depreciating/Neutral |
|
The Average Sold Price per Square Foot is Neutral
The Average Sold Price per Square Foot is a great indicator of the direction of property values. Since Median Sold Price and Average Sold Price can be impacted by the ‘mix’ of high or low-end properties in the market, the Average Sold Price per Square Foot is a more normalized indicator of the direction property values are trending. The April 2022 Average Sold Price per Square Foot of $1231 was down 2.2% from $1259 in March and up 7.9% from $1141 in April of last year. * Based on 6-month trend – Appreciating/Depreciating/Neutral |
|
 |
Whether planning to sell or purchase a home, it can help you strategize your approach by knowing which price ranges are in high demand and which are not. For low to mid-range homes, the most popular were in the $1-2million range, followed by homes priced from $2-3million. Though both dropped off a bit in April, sales in these price ranges have increased dramatically since January. The lowest sales volume was in the $0-1million range.
|
|
 |
| The San Francisco luxury market has improved dramatically since the first of the year. Sales of homes priced from $3-5million more than doubled, from 15 in January to 36 in April. In the $5mill+ market, sales increased from 2 in January to 13 in both March and April. |
|
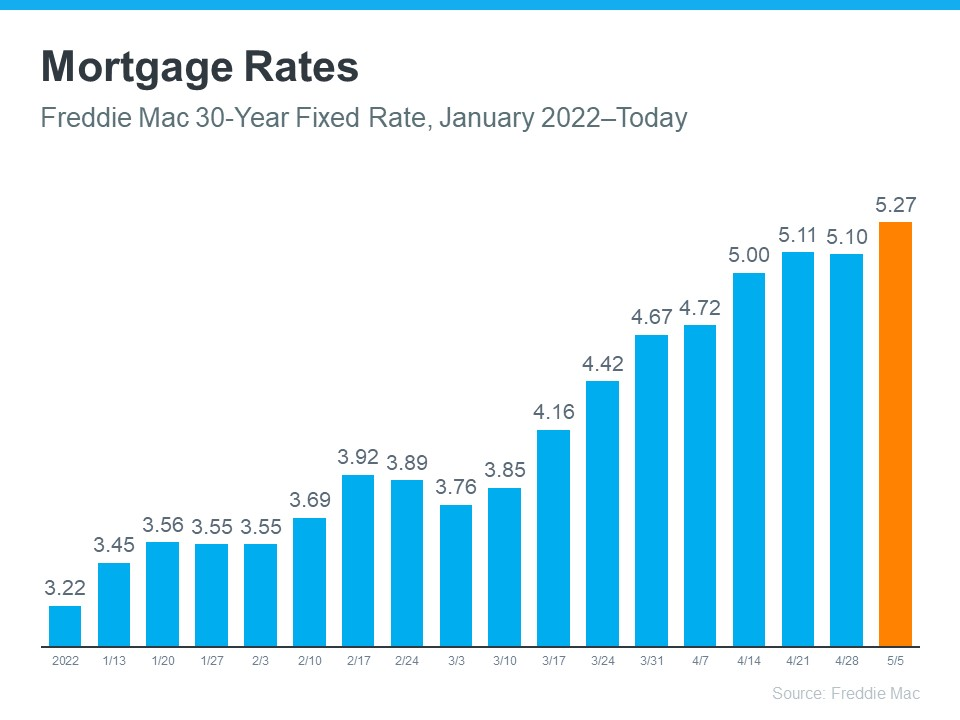
CURRENT MORTGAGE INTEREST RATES
as of May 11 |
|
|
|
|
 Facebook
 X
X
 Pinterest
 Copy Link